Manage and Analyze Logs for Cisco, OS10, and SONiC
Logs are quickly becoming a key performance monitoring tool in modern data centers. Traditional log and metric management techniques combined with new and more efficient collection methods provide a comprehensive set of metrics for both application and network performance. New model-driven telemetry processes stream data from network devices continuously while optimizing data flow. While these approaches provide near real-time access to operational statistics and optimize the efficiencies and proliferation of log-based management, the varied log methods require integrated collection, analytics, and automation to manage data correlation, visualization, frequency of collection, and data retention.
CruzLog collects, stores, and visualizes log and telemetry data for Cisco, OS10, SONiC, and numerous other processes to significantly reduce time-to-deploy and operating costs. CruzLog lets administrators select devices, specify KPIs, automate the deployment of log configurations, tune them for content and collection frequency, and manage data retention for each managed resource. You can also filter log data and create real-time events for more reactive support processes.
CruzLog adds to Cruz Operations Center’s (CruzOC) multi-vendor, multi-technology IT resource management. With seamless integration with CruzOC, support staff can see event, performance, and log data in a consolidated view, and together, they provide a single console management product for managing operations of today's converging infrastructures.
See More Dorado Solutions
Log Analytics and Visualization
ROBO
Edge Management
Virtualized Network Edge (VEP)
Remote Edge Management (VxRail)
Campus IT Management
Key Features
- Holistic visibility to data center health from bare metal through virtual functions.
- Consolidated visibility and processing of event, log, and telemetry metrics.
- Real-time log alarm generation and management.
- Manage log volumes by selective capture and automated data retention policies.
- Automated device log deployment and ongoing management.
- Automate recurring operations and closed-loop error remedies.
- Collect logs from wide variety of sources and formats.
- Manage multiple log and file formats (Syslog, File, CSV, Packet, etc).
- Manage new buffered telemetry formats (GPB)
- Automatic deployment of log management processes.
- Control filtering and frequency of log collection.
- Create alarms from log data for near real time correlation and management.
- Intelligent dashboards to dynamically analyze data.
- Supports offline data archiving.
- collects filters and visualizes the relevant infrastructure and process metrics for your data center.
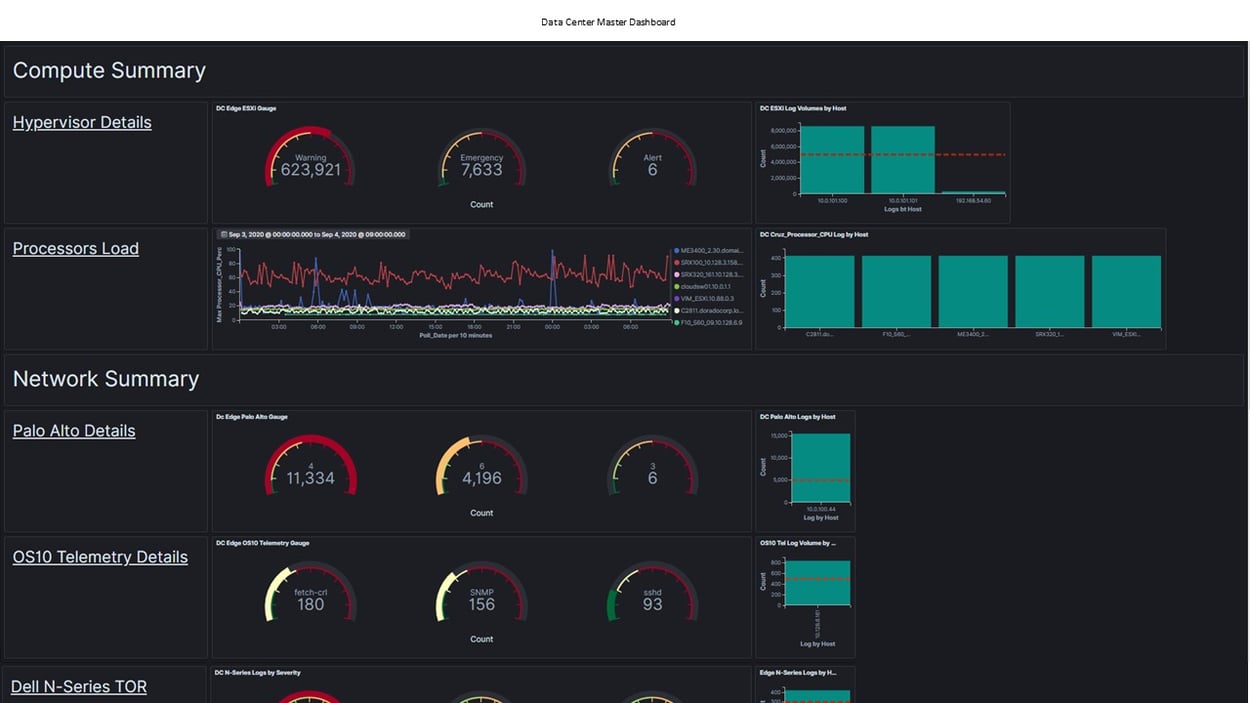
CruzLog Data Center Dashboard: Consistent view of key metrics of each managed component for quick recognition of current, or potential, support issues.
>> See A Demo
Dashboard Highlights
- Quick drill down for more details for each managed resource.
- Collect telemetry data from compressed formats such as Google Protocol Buffers.
- Dynamic visualization for real-time analytic filtering.
- Click on current visualized object to isolate focus on that object.
- Create a filter for description and select from pull down.
- Manage existing filters to enable or disable; inverse or delete.